
I recently read an article by a fellow Liverpool fan, BassTunedToRed , which went into how many points per game (PPG) Dalglish has achieved in his second stint with Liverpool. Have a read of it here.
As you can see, the form that Kenny is showing to date, would have us finish in the top 4 every year since 1995. And at least 3rd in all bar 3 seasons. Got to say, that is pretty impressive.
If you read a little further down however, you will see a comment from myself. I explained how our PPG against the “top 5” (i.e Spurs, City, Arsenal, United, and Chelsea) see Kenny having a 2.17 PPG. But as you look deeper, you soon see our PPG against “lesser sides” is letting us down.
This has been our problem at Liverpool now for many a year. As far back as I can remember, poor performances, and “dropped points” against weaker sides, have cost us a higher league position. And in 08/09, there is an argument it cost us the league title too.
Surely, we pick up more points against the weaker teams?
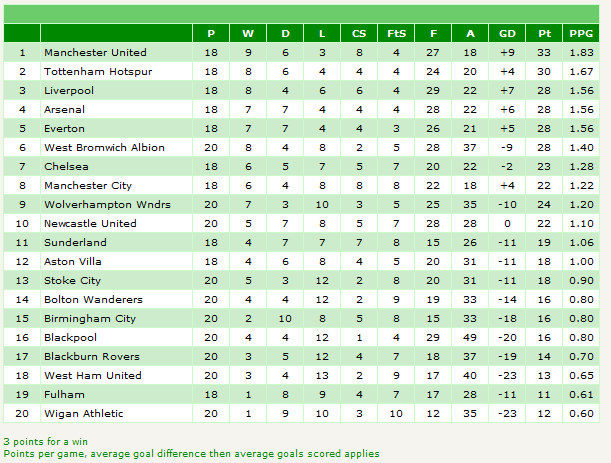
To see if this theory is true, I decided to look at our performances against the “Top Half” and “Bottom Half” of the league. I will look at the last 5 seasons (so as far back as 2006-2007), and see if there is a pattern across the board, and across managers. To do this, I have used a variety of tables taken from the excellent website, http://www.statto.com .
Some headline figures first. Against the top half, we average 1.57 PPG. The bottom half, we average 2.1. So, I must be talking nonsense? Clearly, our results are a whole “half a point” better. That is 10 more points against the bottom half of the table, when compared with the top half. This sounds like we need to improve against the top half, right?
Well, not really no. There is no surprise that against the lesser sides, we will pick up more points than against the better ones. The problem is, our performance relative to the other sides. So, lets look a bit deeper.
Our average position in these seasons is 4.4. Our average position against the bottom half is 5.2. Against the top half, our average position is 4th. One place lower, is the difference between Champions League Football, and the Europa League. Or in 2008/2009, the difference between the League Title, and runners up. (Top half position 1st. Bottom half position 3rd. Overall position 2nd).
So, our performances against the top half of the table, are dragging us up the table. Or, if you look at it the other way, our performances against the bottom half are dragging us down.
Is this a problem for “Liverpool”? Or was it individual teams/managers?
To give us some credit, this isn’t always the case. Across the 5 seasons, our “Bottom half” final position has only been worse than our “overall position” twice. This was in 2008/2009 (the difference between winning the league and not), and last season. The figures in fact are heavily distorted by 2010/2011, where we finished 3rd in the top half, and 11th in the bottom half. One of the worst differences in the whole league, and the worst in the “top 6”.
Was this the Roy Hodgson factor? Or, is it harsh to point the blame all on him? Without going over to much old ground, lets just look at Dalglish’s performance in his games (for last season only), and see how he performed.
 from when Dalglish took over at Liverpool.")
The above table shows our performance from when Dalglish took the helm, shown by points per game (as some teams played more than others). A pretty impressive turn around by Kenny, after what was an awful first half of the season.
But how did he fair against the Top Half and Bottom Half? Unfortunately, even the great Statto website doesn’t allow me to create a custom table for Top/Bottom half within a date range. So, I will look at where Dalglish’s PPG against Top Half and Bottom Half ranks against all the teams overall.

Dalglish achieved a very impressive 2 ppg against the Top Half of the table. That would put us top of the “Top Half”. Unfortunately, it doesn’t take a genius to figure out what the next table will show.
Credit www.statto.com")
Dalglish’s Liverpool would finish down in 8th place against the bottom half, with a PPG of 1.63. So clearly, relative to our opponents, we have finished “lower” in the table against the bottom half, when compared with the top. Perhaps more worryingly, our PPG is less against the bottom half, than it is against the top. Just think if we could bring up our PPG against the bottom half, in line with our top half performance? We would finish (in a 38 game season) on 76 points. That would have had us finish 2nd last season.
However, as I said earlier, over the years we have performed better (PPG wise) against the bottom half. It is our relative position to our rivals which has let us down. In the last 5 years, we have picked up 34% more PPG against the Bottom Half (compared with the Top). So, using that same 34% as an assumption, then our PPG benchmark against the bottom half (based on a 2 PPG V Top Half) should be 54 points. Add that to our Top Half PPG (18 games at 2 PPG = 36), would give us a points total of 90 points. More than enough to win the league in most seasons.
There is clearly an area that we can improve on here. An area we need to improve on, in order for us to compete with the “top 4 again”. Perhaps more importantly though, an area we must improve if we want to win the league in the future.
So, Dalglish struggled against “lesser sides”? Is this his managerial style? Or, is it more to do with the players?
I’ll be honest with you here, most of this I kind of already knew. It is something I have looked at before, but never really written down and put into context. This next part however, I genuienly am unaware of what I will find.
Dalglish has managed two other Premier League sides of course. Blackburn (where he won the League Title) and Newcastle. He also managed ourselves to great success in the 80’s. The question I am going to ask, does Dalglish perform better against the Top Half throughout his career? Is this his “style”, and will we have to continue to over compensate against the Top Half? Or, is it something else?
Before I do, I just want to be clear. I have only looked at full seasons in charge. So when Dalglish joined/left mid season, I have ignored those results. This is because the Statto site doesn’t allow me to build a custom table. But there is still plenty of data to draw a conclusion from.
Blackburn Rovers (Full Seasons in charge from 1992/93 – 1994/95. In 1995/96, Dalglish became DoF).
Dalgish at Blackburn averaged (over 3 seasons) 1.94 PPG. It is good to see that his PPG against the “Bottom Half” was much better than against the “Top Half (1.90 TH V 2.33 V BH). So, Dalglish has shown, at Blackburn, his side can pick up more points against the “lesser” sides. So that is good.
Bu what about the other important factor, average finishing position in the Top Half and Bottom Half? His Blackburn side averaged a finishing position (v Top Half) of 1.67 (2nd, 2nd, and 1st). However, against the bottom half, average finishing position was 5.67 (12th, 2nd, 3rd).
It is fair to say that these figures here are heavily distorted by the poor performance against the bottom half, in his first full season (in the Premier League) in charge. Also, Alan Shearer missed a large chunk of the 92/93 season after a serious injury in December. Did Shearers absence effect the sides performance against the bottom half less so than against the top half? Possibly, yes. Or maybe Blackburn raised their game (after being recently promoted) against the “bigger” sides. I don’t know for sure, but after the first season, the trend went the “right” way.
Newcastle United (Full season in charge 1997/98)
Only the one full season in charge here with the Geordies, and it is fair to say, it wasn’t his most successful. Dalglish led Newcastle (from January 97) to finish 2nd in the Premier League, but in his only full season, it was a disappointing 13th place finish. And after a poor start to the 98/99 seasons, he left after just 2 games.
Against the top half, Dalglish’s Newcastle picked up just 0.90 PPG. Against the bottom half, it was 1.44. While the PPG figures are low, again, it is clear a Dalglish side can pick up more points against “lesser” sides than against the better ones (something to date remember, his new Liverpool isn’t doing).
In terms of position finish? Top half results was 15th. Bottom half (and overall) was 13th.
It is probably important not to over analyse these figures, certainly from the value of the PPG, because it doesn’t include his best results at Newcastle. From January 97, to the end of the season, he finished in 2nd place, and had a much better 1.88 PPG.
Liverpool (Full Seasons in Charge 1985/86 to 1989/90)
Dalglish managed Liverpool for 5 full seasons. He won 3 league titles, and could have been four, if it wasn’t for the last minute goal for Arsenal, in the last game, for them to take the title on goals scored (in 1988/89).
But not only were Liverpool adding trophies to an already bulging trophy cabinet, they were doing it in great style, with great players.
What about the stats though, and the performances against the Top Half / Bottom Half?
Dalglish’s 80’s Liverpool found, what I believe to be, the secret to winning the league (or at least being a top side). Like at Blackburn (bar his first season), he consistently picked up more PPG against the bottom half, than he did against the top half (average Top Half 1.83 PPG, average Bottom Half 2.05).
Also, his average finishing position was better against the “lesser sides”. This was 1.6 (compared with 2.4 against the top half).
Is this the key to success? Recent history says yes, it is.
Throughout Dalglish’s managerigal career, he has shown in the main (bar one season with Blackburn), his sides will perform better against weaker sides, than against stronger ones (based on final position). This doesn’t guarantee success (see Newcastle), but in none of his other successful seasons, has he achieved a better PPG against the top half, when compared with the bottom half.
Manchester United, who have won the league title in the last 3 seasons, have always picked up more PPG against the bottom half, when compared with the top half. In fact, in the last 5 seasons, they have never finished out of the top 3 on the “bottom half table”. And remember I mentioned 2008/2009 earlier? How our “bottom half” performance let us down? United dropped just 2 points against them. That is 19 wins, 1 draw.
I firmly believe that the key to success is ensuring that you can achieve more points against the lesser sides (relative PPG), but also ensure you are in and around your rivals in the relative bottom half/top half table. Finishing top of the “top half” and 8th in the “bottom half” may get us into the top 4. But it wont win us the league, I don’t think.
So, what is the answer here?
Again, I will be honest with you. I genuinely did not know what I would have found when I looked at the historical Dalgish sides, and his relative managerial performance. I may have found that Dalgish achieved success by picking up more points against the top sides, and if I had, I would have give him a massive pat on the back. Had this been the case, then it may have gone down to his “managerial” style. Attacking the top sides, who will attack you back, and leave gaps. The lesser sides will defend, and be tough to break down.
But throughout his career, his great Liverpool side of the 80’s being the best example, his teams tore strips off the bottom half sides. They also maintained a very good standard against the top half.
So why the figures last season? A blip? Or do we have an answer to this? I would say it is (and was) the players at his disposal, and the players he had available last season.
For too long, prior to Dalglish’s arrival, Liverpool have been very one dimensional. Or as people famously said “no plan B”. In our best season in recent memory 2008/2009, a series of draws against “bottom half” sides, cost us the league title. They found a way to stop us from playing, by stopping Gerrard & Torres of course.
If these were not playing well, Liverpool rarely won. Players like Benayoun did step up at times (certainly in the second half of the season), however, we still lacked a true, real, plan B.
This became even more apparent when another key player, Xabi Alonso, left in the summer of 2009. A dissapointing season, and another key creative option left, Benayoun in 2010. Torres was misfiring, and his head was no doubt turned elsewhere. Gerrard was looking a shadow of himself, and picking up injuries. No surprise, Liverpool fell down the table.
When Dalglish took over, the side was very low on confidence and low on creativity. It did take a few games to turn us around. But probably the key ingredient to his success, was selling Torres, and signing Luis Suarez.
But even with the Uruguayan, who had a case for the man of the match award in every game he played, Liverpool still struggled to get that PPG ratio right. So while overall team performances improved, our bottom half performances were still not right.
This summer however, we have invested heavily in creative players (Downing, Adam, Henderson – read more about this here) . There is also of course Dalglish’s biggest investment to date, Andy Carroll.
All of a sudden, a one dimensional team, relying on Torres and Gerrard, has become so much more. We can play it on the deck, with quick pass and move. We can play it over the top, and use the pace of Suarez and Downing to get in behind a defence. We can play it down the wings, with Enrique, Downing, Johnson & Henderson to provide quality delivery. We have Andy Carroll, who despite a hit and miss start to his Liverpool career, still has plenty to offer this side.
We finally have quality set piece options. Charlie Adam and Downing with their left, Henderson and Mereiles with their right. This will (hopefully) allow Gerrard to do his damage in the box (or on the edge of it). And I haven’t mentioned Dirk Kuyt, who has his doubters still, but he continues to put in a real shift (he was key in the first goal against Bolton).
How does a side defend against all of that? From what we have seen in our opening 3 league games, we have seen a huge variation in our style of play, and the goals we have scored. Just to re-cap, we have scored from a free kick crossed in the box, a corner, a counter attack, and some great defence splitting pass and move. Carroll also had a goal (harshly, in my opinion) chalked off after a long diagonal ball into the box. And this is only 3 games.
It is still early days this season, but I will be very interested to look at our Top Half/Bottom Half performance come the end of the calendar year. Halfway through the season, will hopefully give us a good indicator of where we stand. I am very confident, we will see a huge improvement in our fortunes against the “lesser sides” under Dalglish, and this will be the secret to success, and our achievements this season.


[…] View the full story here: Anfield Index […]
[…] Dalglish – Top V Bottom | The Secret to Success – Anfield Index […]