In part 1 of the lineup analysis, I had a look at our goalkeepers and defense. Part 2 will focus on midfield and attack.
The midfield
Even after Karius’ nightmare performance in Kiev, the midfield is still Liverpool’s weakest line going into 2018/2019. Emre Can is likely leaving, James Milner will be 33, Jordan Henderson is injury prone and not consistent, the Ox is injured, Gini Wijnaldum has a tendency to disappear at times and Adam Lallana had the worst season of his career. Overall at least in terms of bodies midfield was the only zone in which we had depth. Even with all the injuries at the end of the season, Jurgen Klopp managed to field a competent trio in the middle of the park for most games:
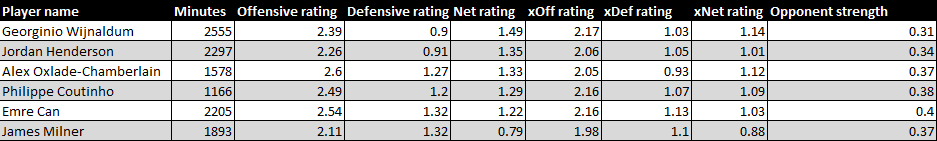
Six midfielders managed to log in over a thousand minutes. Granted some of Coutinho’s and Oxlade-Chamberlain’s minutes were in attack. Gini and Henderson have by far the best defensive rating in the team at 0.9, while the Reds scored the most goals per 100 minutes, perhaps unsurprisingly, when Ox was on the field. The former Arsenal man also has the best xDef rating. His low defensive rating can be explained by the quality of the opposition he faced. Emre Can was on the field against the best opposition relative to the rest of the midfielders and hence the terrible defensive rating. Milner and Henderson are the only midfielders, who have below team average offensive ratings. The xOff rating of all 6 players in the table is within 0.2 xG, that points to a consistency in terms of offensive creativity. The same can be said in terms of the chances allowed in front of our own goal – a 0.2 difference in xDef rating between the best and the worst player.
An interesting part of this comparison is the fact the LFC’s former Brazilian magician (who we could have used in Kiev by the way) is not an outlier in any of the categories. To simply put it: the team played as well with him and without him:

As one would expect the offensive rating with Coutinho is better than without him, but the team compensated that by improving defensively. In the end the Net rating is practically the same. The xG based rating are also similar, so the Reds found a way to replace the Brazilian’s creativity. This just shows that Klopp’s system works no matter who the players executing are. The end result varies based on player quality but the performance level rarely below par.
With so many players playing over a thousand minutes the sample size for our midfield threes is bound to be very small. It’s still worth a look:

The table just confirms what our eyes already know – a midfield three of Gini, Hendo and Milner is not creative enough, especially against inferior opposition. The reason for that is the three of them can mainly create chances out of pressing and there aren’t a lot of pressing opportunities against teams that sit deep and boot the ball away. The Reds will have a chance for another crazy European adventure and I expect a lot of rotations in midfield in 2018/2019. Hopefully, the most played midfield three next season isn’t as bad of an outlier as over the past campaign.
The attack
Perhaps the only line of our squad that was consistent through the year. Sadio Mane had his share of injuries and a suspension while Mo Salah spent the most important sixty minutes of the season in a hospital. But that’s about as healthy as you can expect footballers to be. The front three wasn’t simply healthy, they delivered the goods on the field:

The drop in offensive rating between our starting front three and their backups is truly astonishing. The sample size Solanke, Sturridge and Ings is very small but we have all seen the team struggle when one of our nuclear trio is not playing. Bobby and Mo have exactly the same offensive numbers mainly because the have played most of their minutes together. Firmino’s defensive rating is slightly worse than Salah’s because the Brazilian was on the field for a few of the meltdowns after the Egyptian was subbed off. The 2.56 offensive rating translates to 92 goals over 38 games. The xOff rating of the starting three is consistent.
The huge contrast between the starting front three all other combinations of attackers is staggering:

With Bobby, Mo and Sadio leading the way the Reds were on pace for 100 goals over 38 games, with great finishing. All other attacking lineups create basically a big chance less per game and have average finishing. The sample size is big enough. Based on the numbers improving our attacking depth is one of the keys for a successful 2018/2019 campaign. The on/off numbers further prove this point:

The Reds were outscored by their opposition in the 570 minutes played without Salah. The offensive rating when the Egyptian wasn’t on the field is on relegation level. The defensive rating without him translates to 51 goals conceded over a whole season. The Reds were terrible without their new talisman. There is also a huge offensive drop off when Firmino is off the field and we struggle defensively without Mane. The pace of Sadio and Mo keeps LFC’s opposition cautious which makes defending easier and leads to a good defensive rating.
Conclusion
If you are still reading this – thank you for enduring through the articles. When I started the article I also had the idea of looking at the lineups as a whole but the sample sizes turned out to be so small it makes no sense. Liverpool’s best lineup based on player’s individual net rating is:
[team1]
That lineup did not play a single second together. Emre Can not being in midfield was the only surprise for me. Klopp’s rotations helped us reach the Champions League final, there is no doubt about that. While there was no realistic chance to challenge Man City in the Premier League the rotations hurt our domestic campaign and the team underachieved. Our starting eleven is as good as any in England or in Europe but we lack depth in key positions. It’s strange to write this but our defense is the line with the best depth. Attack and midfield clearly need strengthening. I still believe in Karius, however, getting a new keeper is now back on the list.