

With the season just over half way gone I thought I’d take a look at Liverpool’s season team stats, see how they compare to other teams at this stage in the Premiership and also take a little look at how those statistics compare to some of last year’s totals. All though this will be a Liverpool based article, from a statistical point of view it’s interesting to note how all teams are doing in the Premier League at this stage. As a side note, each team has played 20 games so far this season, that is, apart from Spurs and Everton who have both played 19 games. Bare in mind that this is just an overview of how we are doing and there will be a lot of charts to describe our current position.
So what stats will we look at? There are countless stats that we could review, however, I have picked a handful that I feel may be the most interesting, or most important, depending on what way you look at it. I’ve broken them down into three key areas. Defence, passing, and attack.
Defence
First off, lets take a look at some of our defensive stats and see how we compare to other teams at this stage of the season.
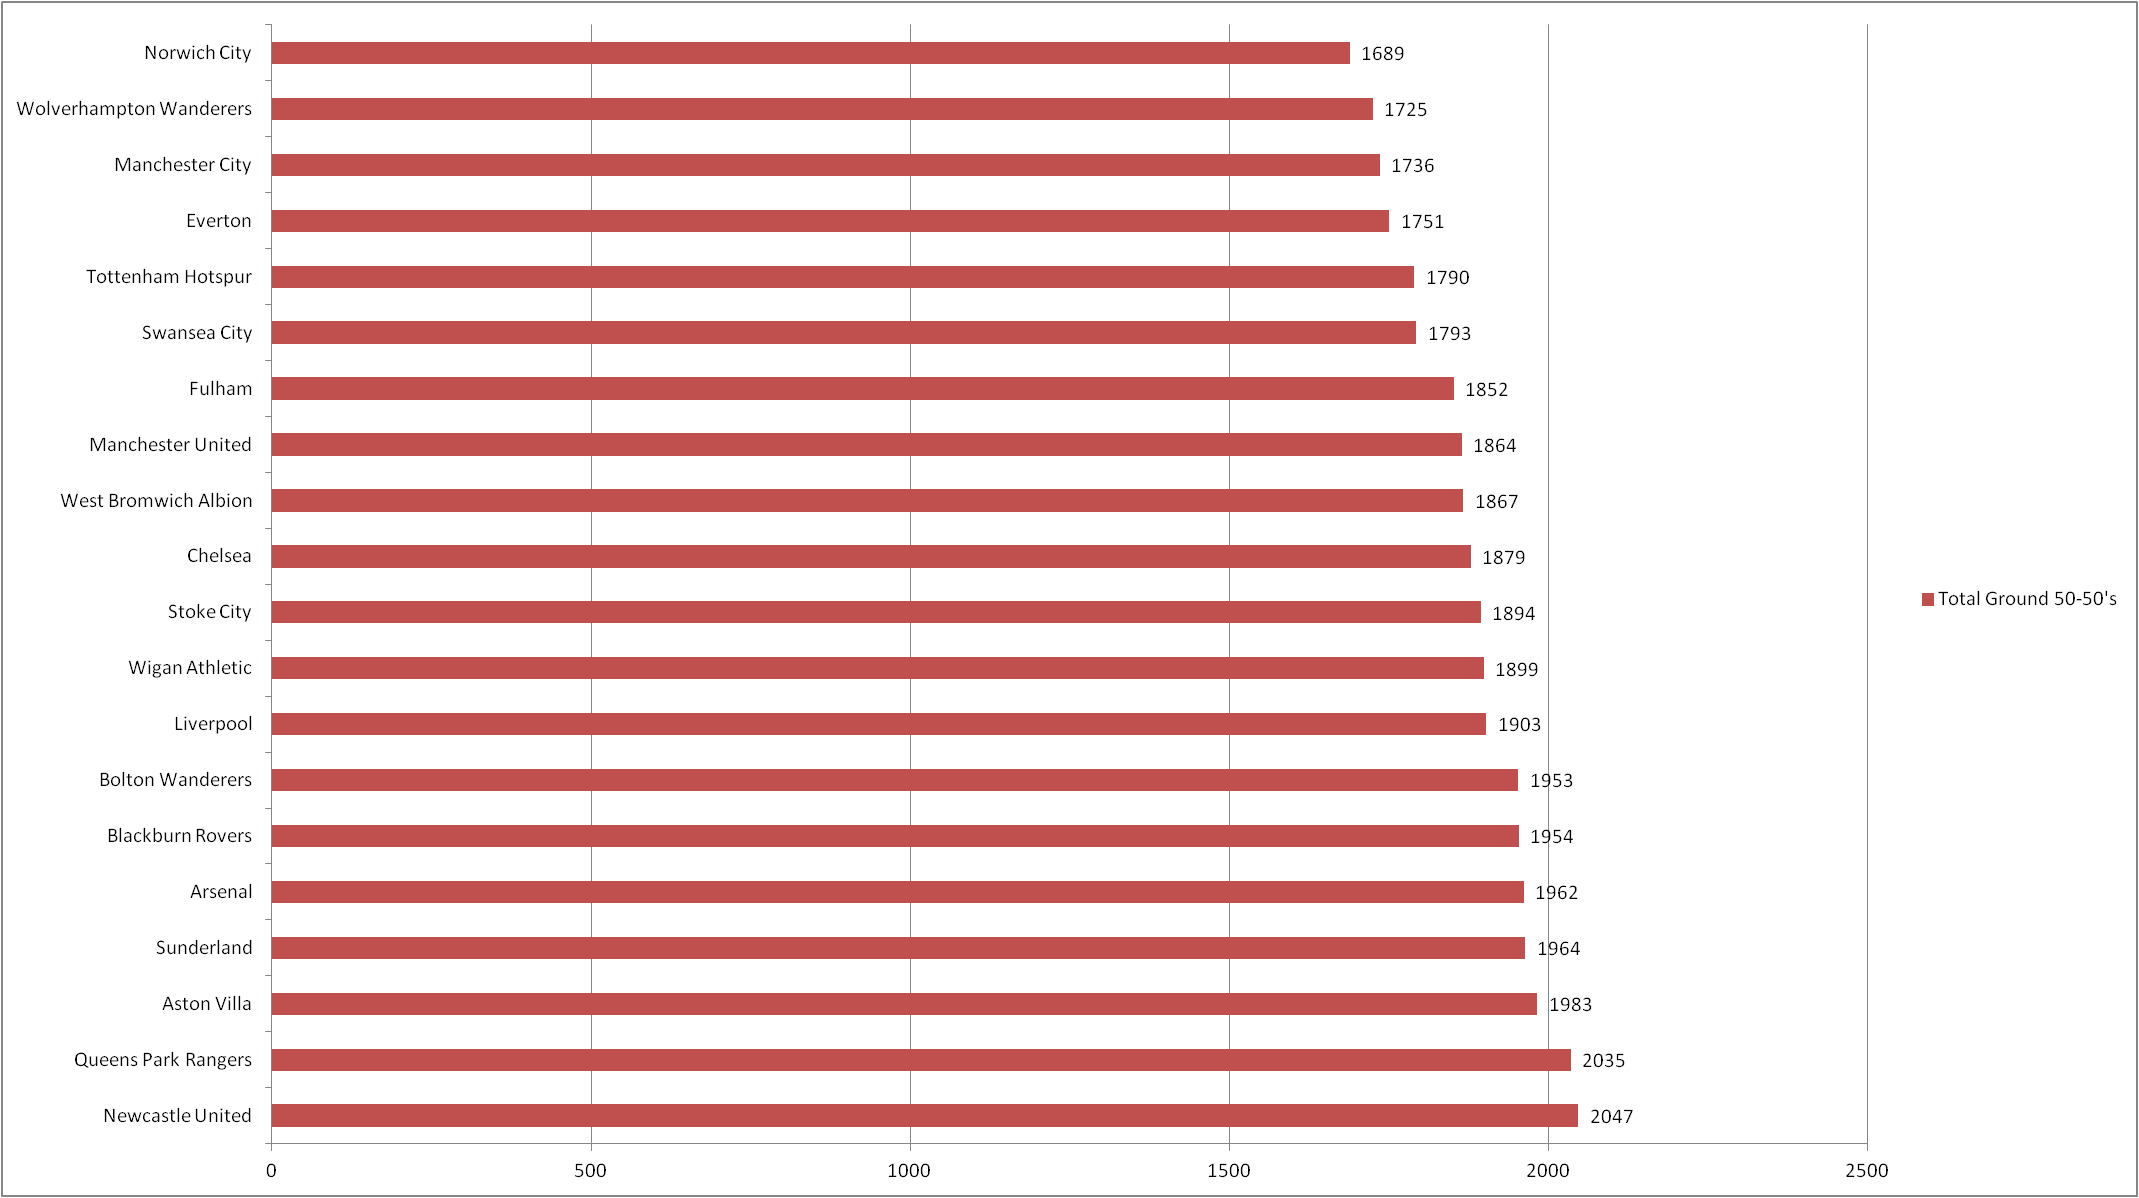
There has been a total of 37540 ground duels in the Premiership this season, (useless stat alert) with Liverpool having contributed to 1903 of those, at 95.15 per game. This number is down on last season’s total of 110.9 ground duels per game. All though it’s worth noting there were 82348 ground duels in the Premiership last season which was an average of 216.7 per game. This season the Premiership is averaging 189.6 per game. So all-in-all there are less ground duels per game this season so far. Also, as you can see from the chart above that 7 teams in the Premiership so far this season have attempted more ground duels than us. Newcastle top that list with a total of 2047 ground duels attempted. So percentage-wise, which teams are winning more of their ground duels this season.
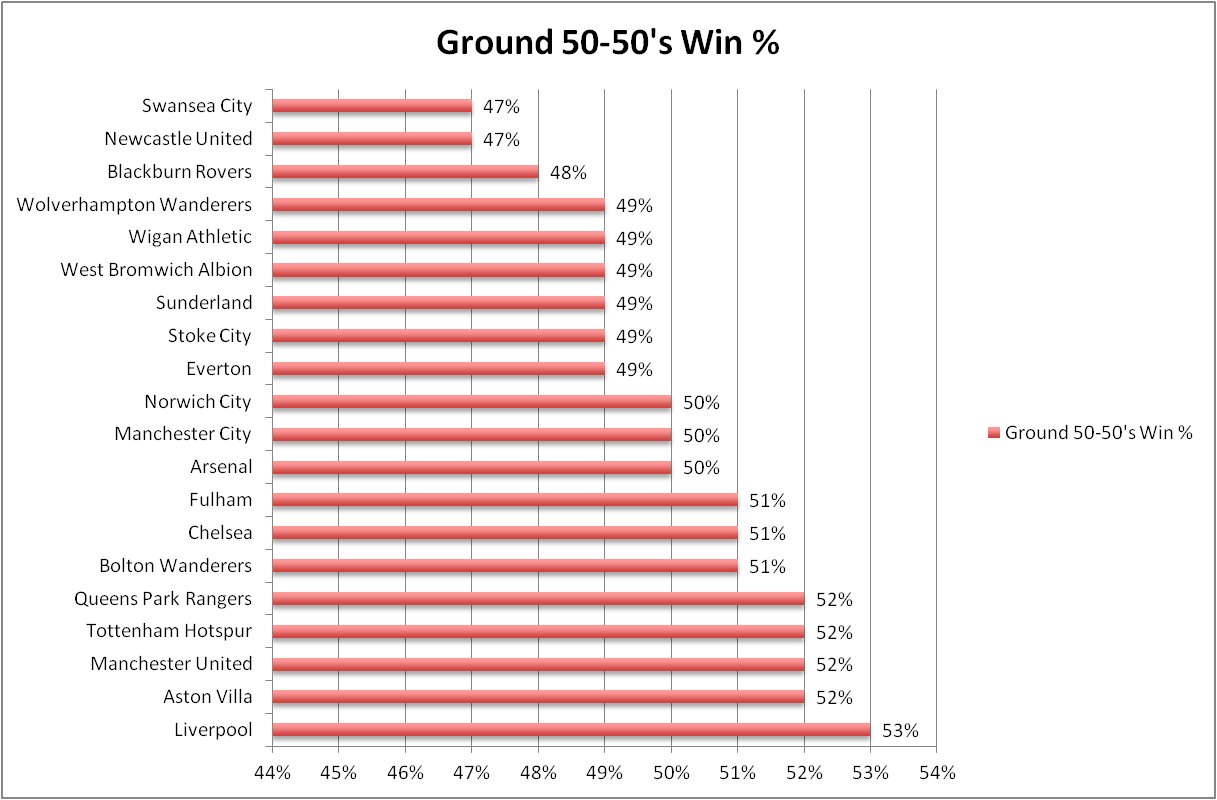
Liverpool come out top in this area with a total of 53% of all ground duels won. It indicates our players can battle with the best of them in the Premiership this season and you have to say in terms of motivation and determination it is a good sign for the rest of the season. It also betters last season’s win ratio of 51%, with Bolton and Spurs jointly topping last season’s list on 53%. It is also worth noting that there is only a 6% difference between Swansea at the bottom of the chart and us at the top. Does this indicate maybe the quality of the competitiveness of the Premiership?
So how are Liverpool doing with their aerial ability. Let’s take a look at the chart below and see the total aerial duels for each team this season.
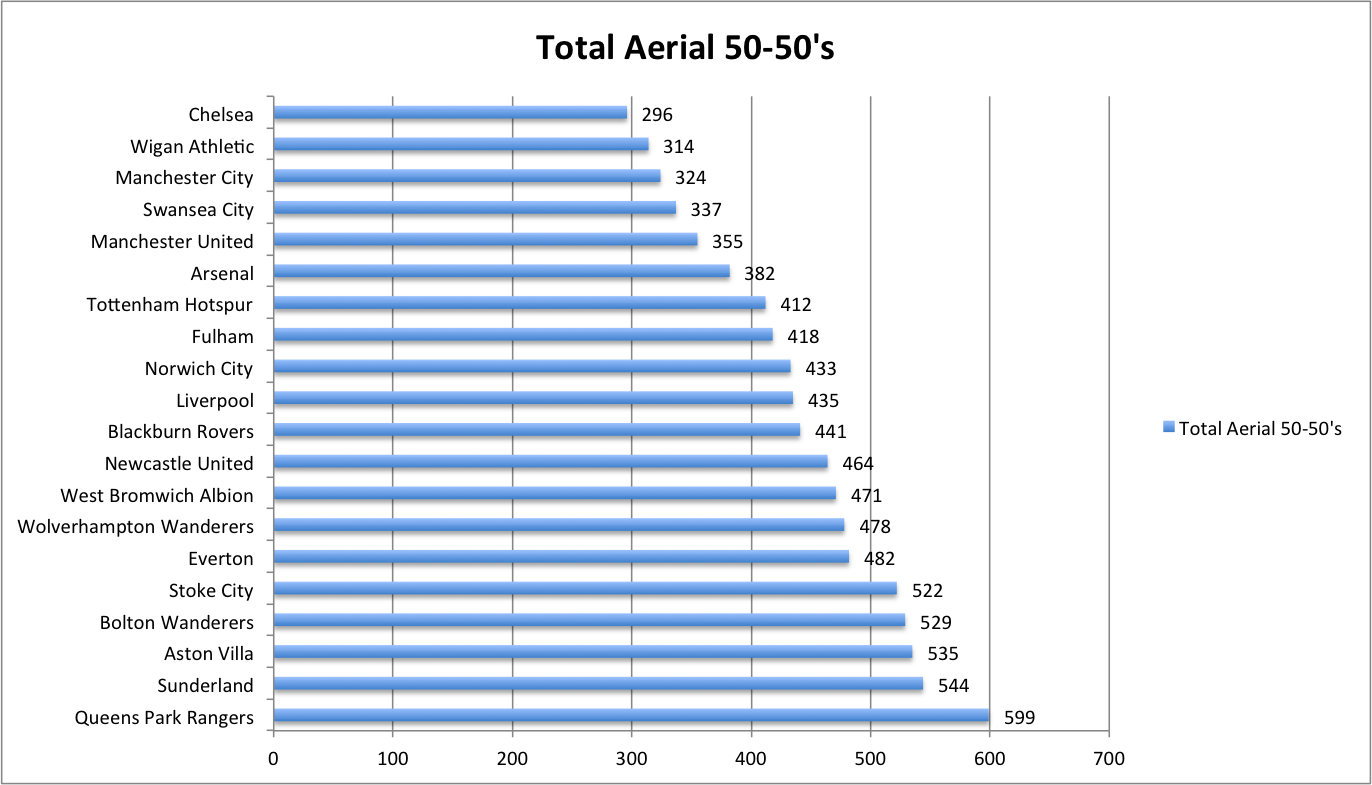
I’m not sure how useful this statistic is. Being involved in more aerial duels doesn’t necessarily mean your play is more aerially focused. It could just mean that the teams you have played against play more aerially against you. You’d expect Stoke however to be involved in more aerial duels than most considering they like to get the ball into the box at every opportunity. Surprisingly though it is QPR at 599 aerial duels who top that table, over double the amount Chelsea have been involved in at 296. Liverpool are averaging 21.75 aerial duels per game compared to last season’s 27.5 per game. That’s a difference of 5.75 aerial duels per game we are involved in. Has the Premiership itself changed in style and more teams are now playing the ball on the ground or is it our change of style that is affecting this statistic? Well the total aerial duels in the Premiership last season was 22917 at 60.3 per game. This season there have been 8771 aerial duels to date, at 44.3 per game. So not only have we less aerial duels but the Premiership as a whole has 16 less aerial duels per game. The 09/10 season had 24390 aerial 50-50’s at 64.2 per game. So a continuing downward trend may indicate a style of play change as a whole. Next let’s take a look at the aerial duel win percentage.
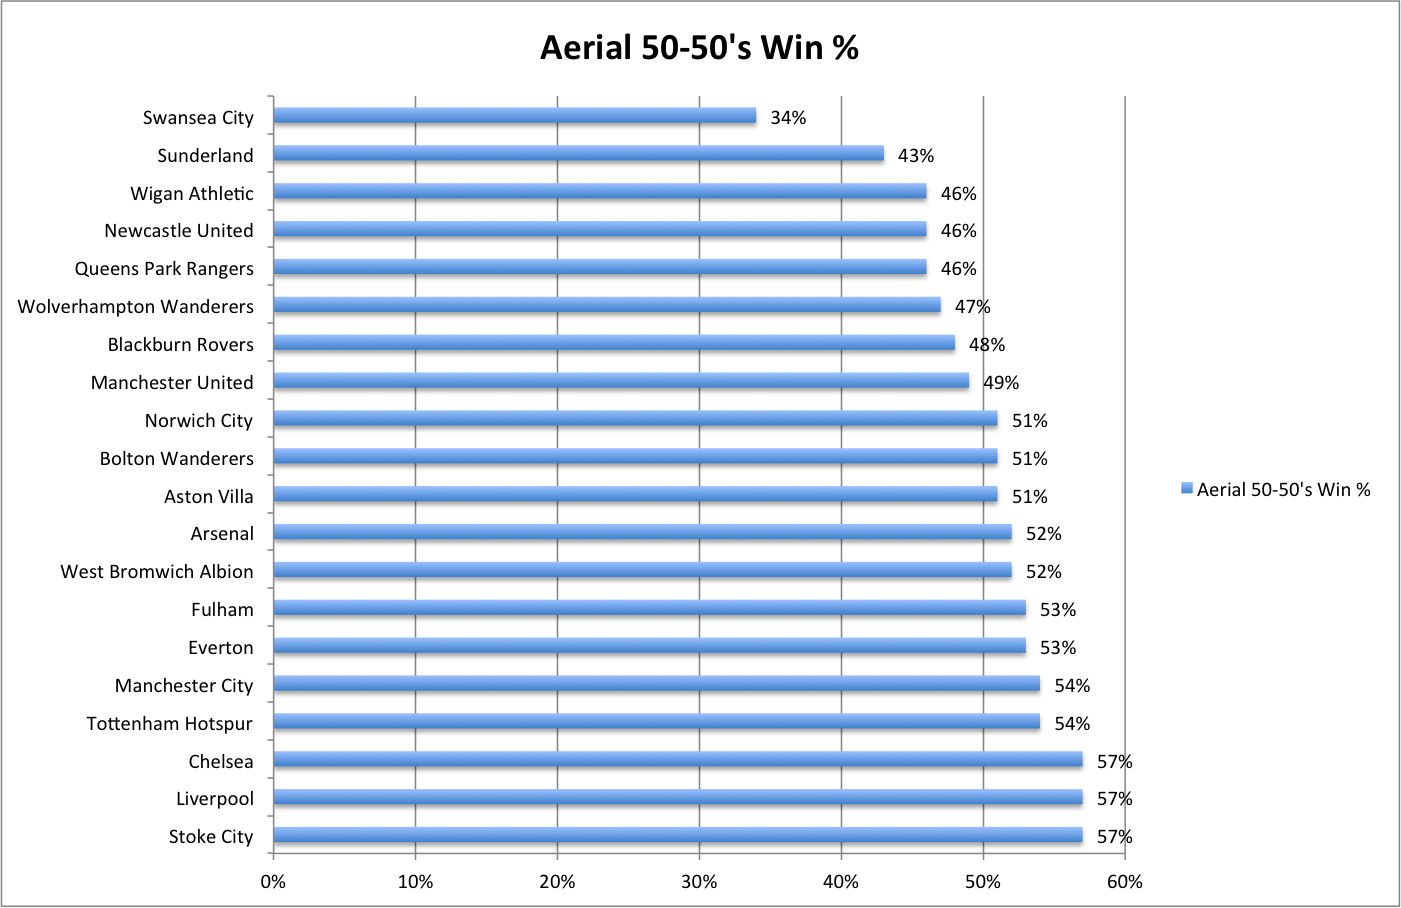
Well as you can see from the chart LFC are joint top with 57% (6% up on last season’s 51%) of all aerial duels won along with Chelsea and Stoke on 57% also. Swansea, unsurprisingly in my opinion, due to their insistence on playing the ball on the ground are bottom of the table on 34%.
Lastly in the defensive area let’s take a look at the tackles statistics for the season so far. First up is our total tackles chart below.
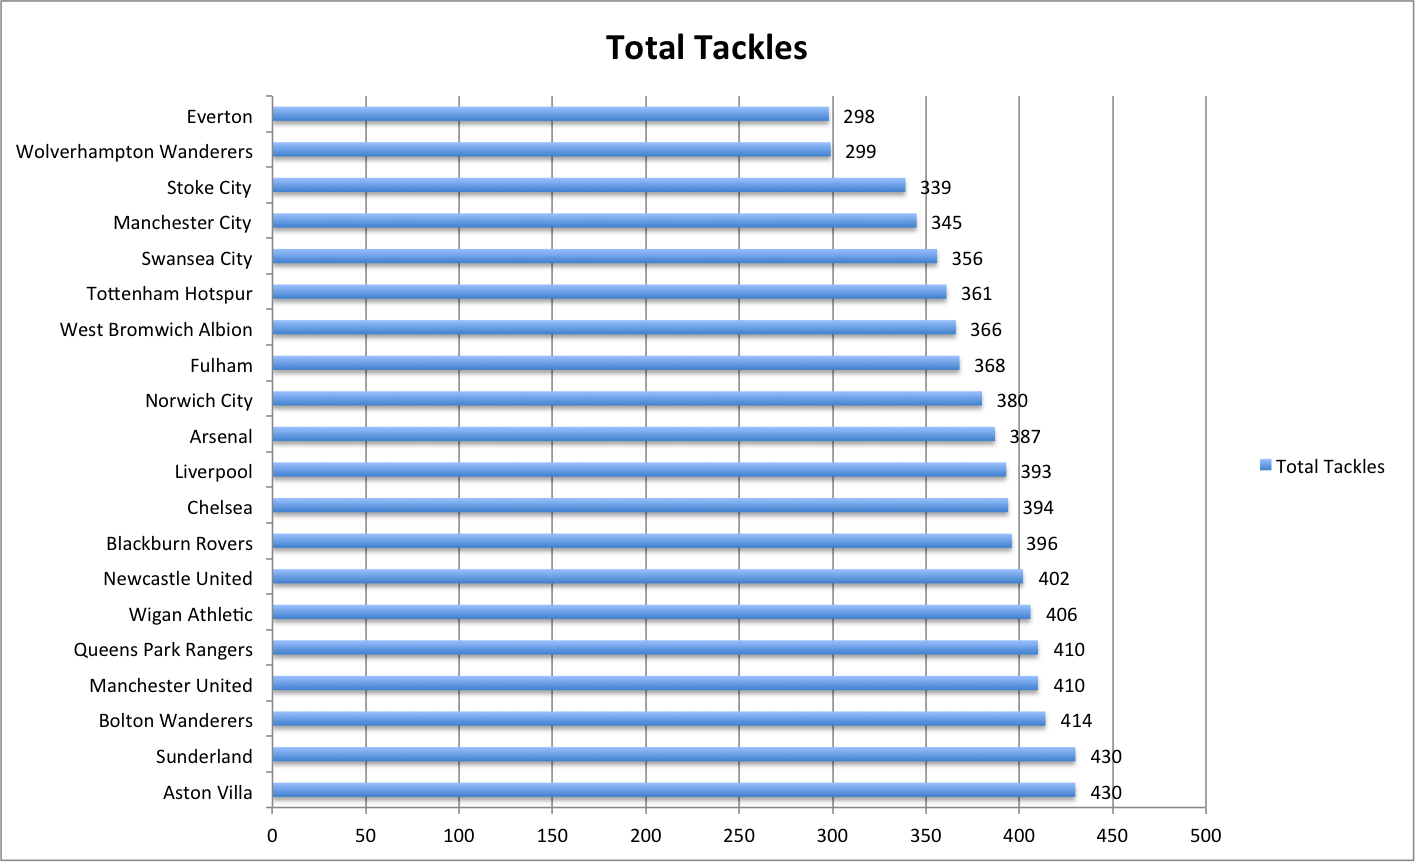
Liverpool sit in mid-table mediocrity here with 393 tackles attempted this season. With 20 games played that’s 19.65 tackles per game. Compare that to last season where we averaged 23.89 tackles per game and maybe, again, it’s the difference in our style of play that has us putting in less tackles per game. Certainly we don’t lack motivation as our aerial and ground duel win percentages are high.
Lastly in the defence area let’s take a look at the tackle win percentages this season. Take a look at the chart below.
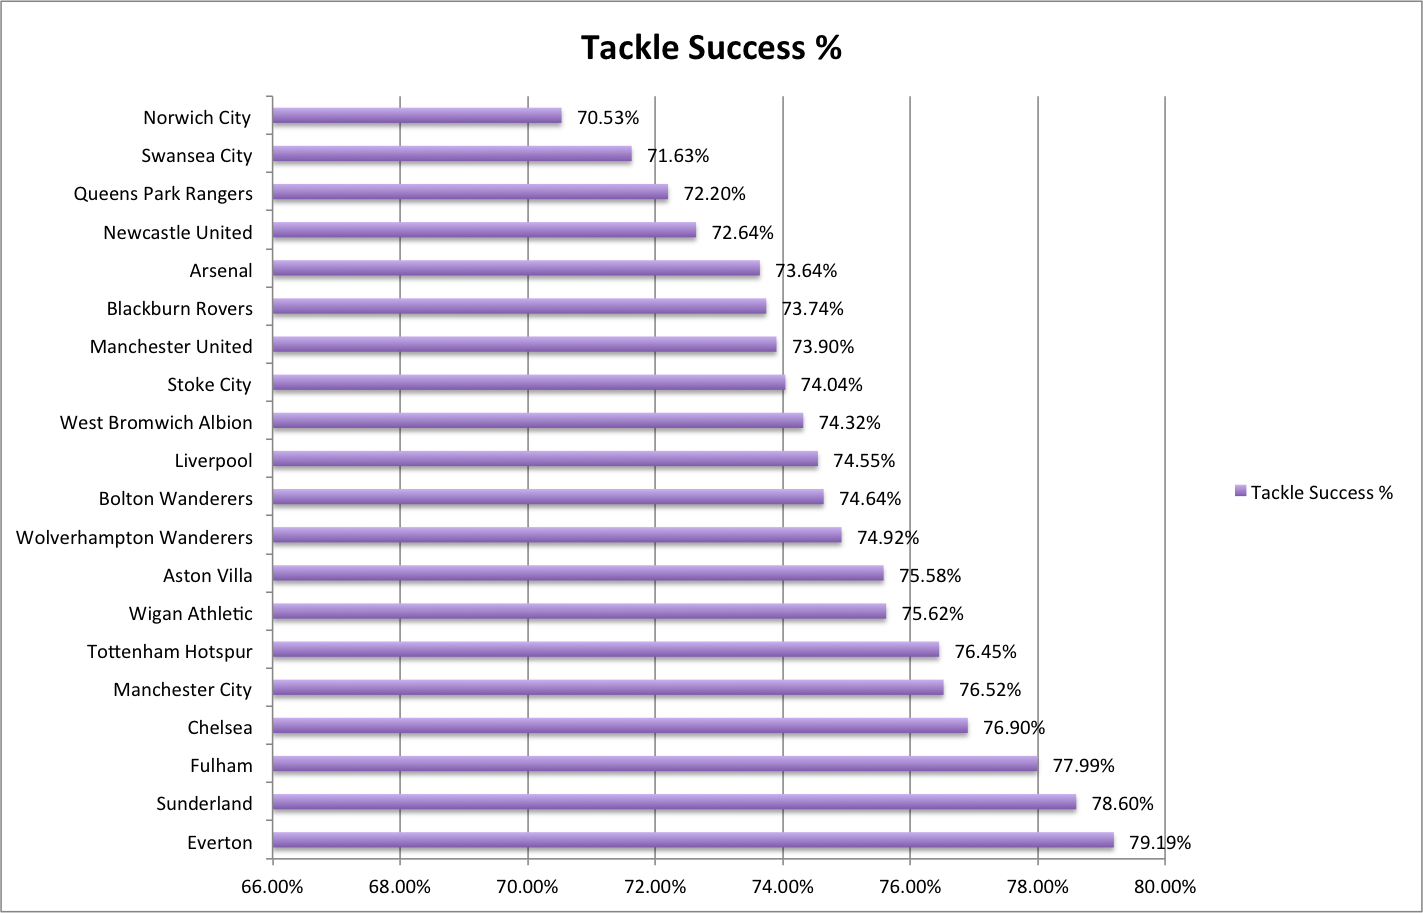
Everton top the chart with a 79.19 tackle success rate. It’s worth noting that Man United topped this statistic last season with 76% of all tackles won. So Everton are doing quite well in this statistic this season. Liverpool are currently winning 74.55% of all their tackles. An average statistic, however, we were second worst in the league last season in this statistic with only 69% of all tackles won. So we have increased our tackle win ratio by 5.55%.
Lastly in the defensive category let’s take a look at the ‘dribbled past’ statistics.
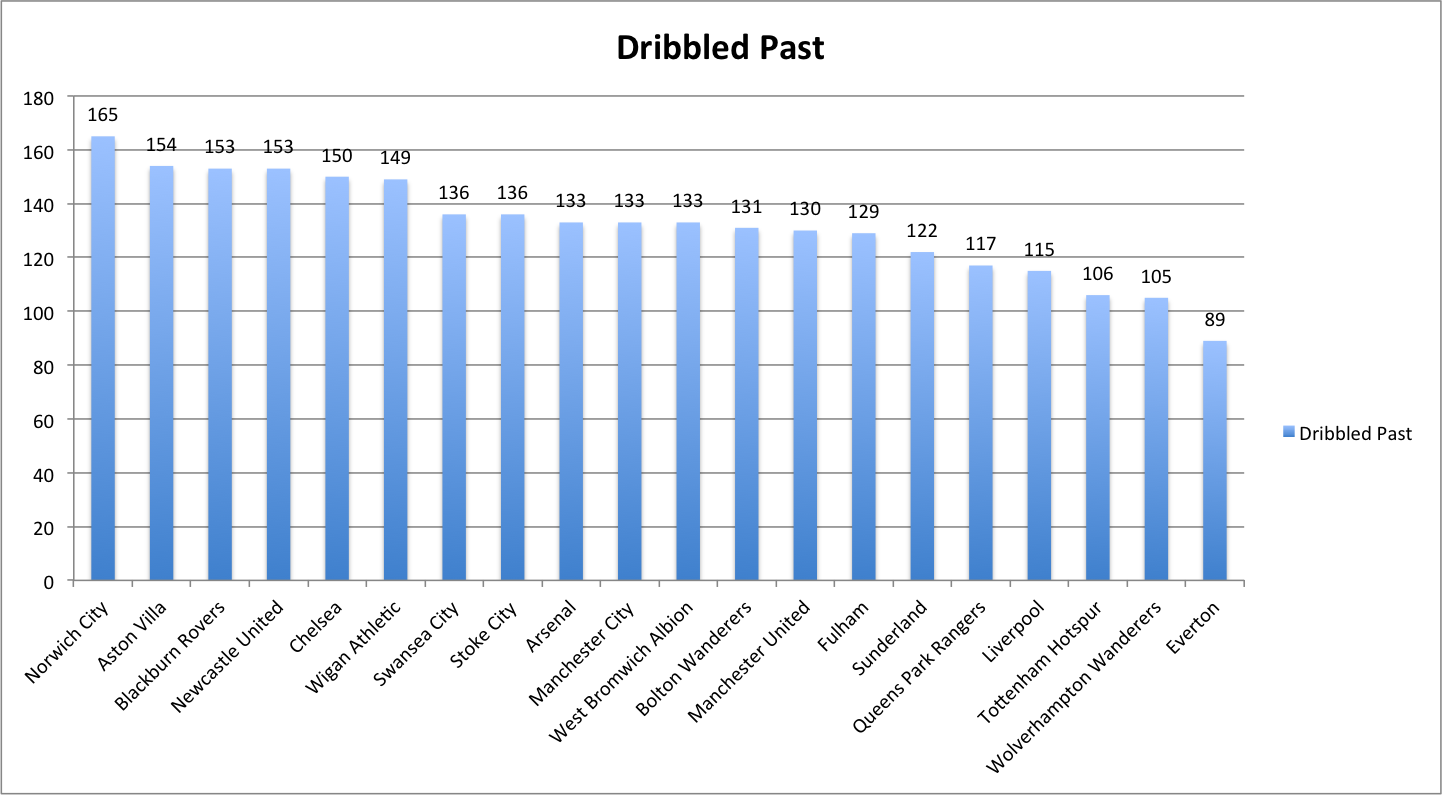
Norwich City come out worst in this area, with their players being dribbled past 165 times so far this season. Everton come out top having only been dribble past 89 times. Liverpool do quite well in this statistic with having only been dribbled past 115 times or 5.75 times per game. Last year we done quite poorly in this area having been dribbled past 286 times for the season or 7.53 times per game. Only 4 teams (West Ham, Fulham, Blackpool & Bolton) had a poorer record than us last season. So an area where we have improved considerably.
Passing
Next let’s take a look at some passing statistics. Take a look at the total open play passes chart below.
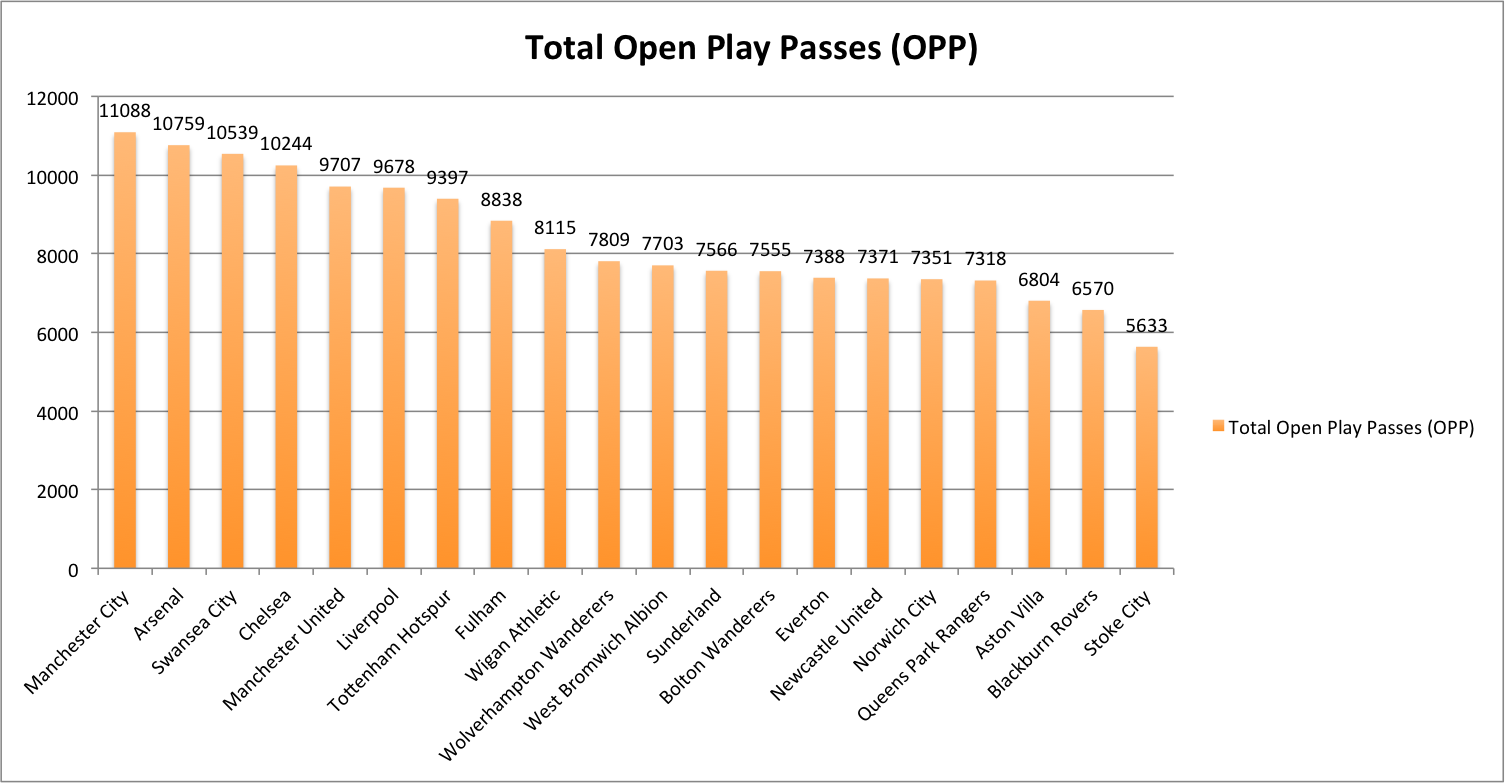
The more passes you make in a game doesn’t necessarily mean you are going to win that game. Case in point recently was Liverpool’s game against Manchester City where we lost the game 3-0 and dominated the possession. Albeit with City having a man sent off. Liverpool completed 511 passes in that game, which was the most completed passes of any game this season or last season. The closest game last season to that statistic was Everton away where we completed 481 passes and the closest game this season was Blackburn at home where we completed 456 passes. Having said that, the more passes you make, the more possession you have, the more possession you have the more time you are in control of the ball, and the more time you are in control of the ball, the less chance the opposition will score. All these areas increase your chances of winning games, and the chart does show that the top teams do make more passes per game. Bluntly put, my point is, it is a statistic which relies heavily on context. This season Liverpool are averaging 483.9 passes per game, last season we averaged 440.2 passes per game. So we are attempting 43.7 more passes this season per game.
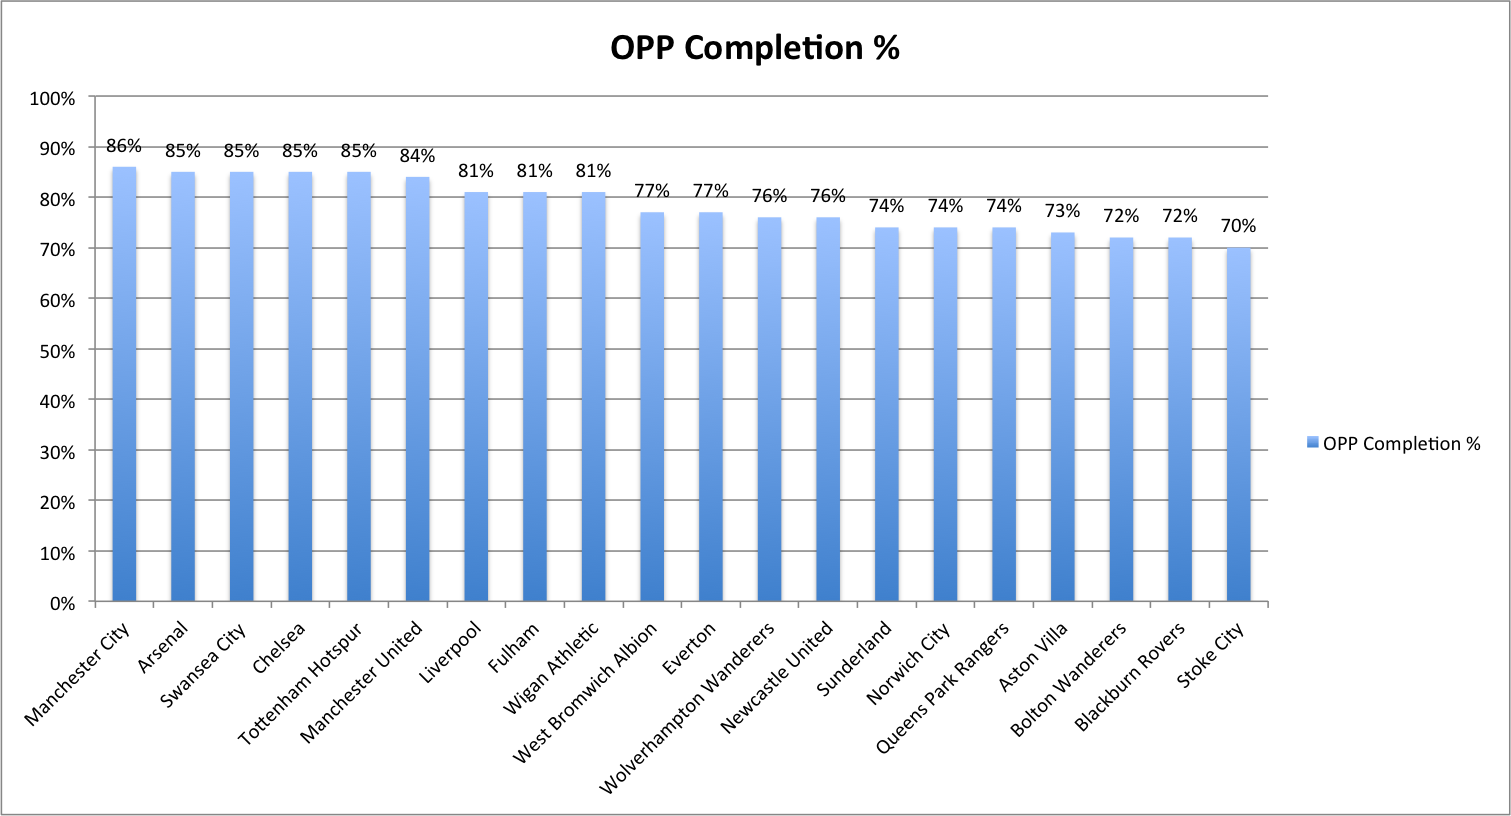
When it comes to passing accuracy Manchester City top the table with an 86% pass success rate. Liverpool have a very decent 81% ratio, which is an increase on last season’s ratio of only 77%. Ideally you would like to be up around the 84% rate, however, considering the influx of new players this season, and the time it takes for those players to gel, I think kudos must go to the training methods we are using this year to better our rate from last year.
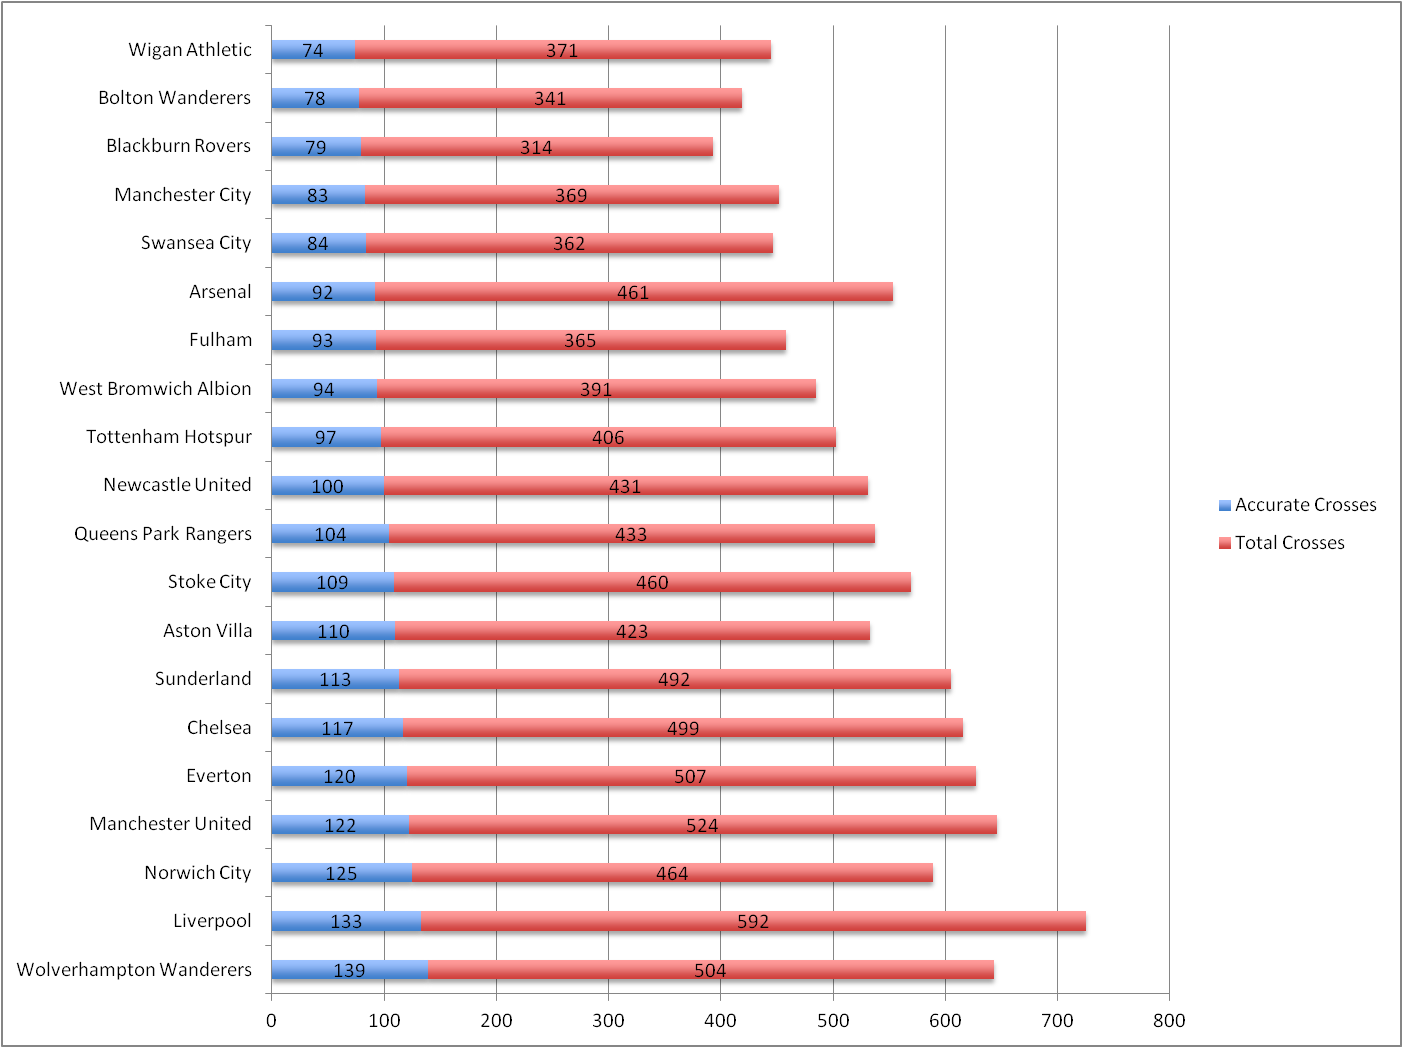
Along with chance conversion a lot has been made or our crossing this season. What is clear from the above chart is that we have attempted more crosses (592) than any other team this season. We are averaging 29.6 crosses per game, to me that sounds like an enormous amount. Especially when you consider that perhaps our most dangerous player in the air, Andy Carroll, hasn’t started a lot of those games. Last season we averaged 21.7 crosses per game, so it’s a big increase on last season. In terms of accurate crosses only Wolves (139) have completed more accurate crosses than us this season. When you consider we only successfully completed 168 crosses in total for the whole of last season and this season we are all ready on 133 then you begin to see the bigger picture. Whether this has been a tactical move, or just by design, it’s an incredible statistic nonetheless.
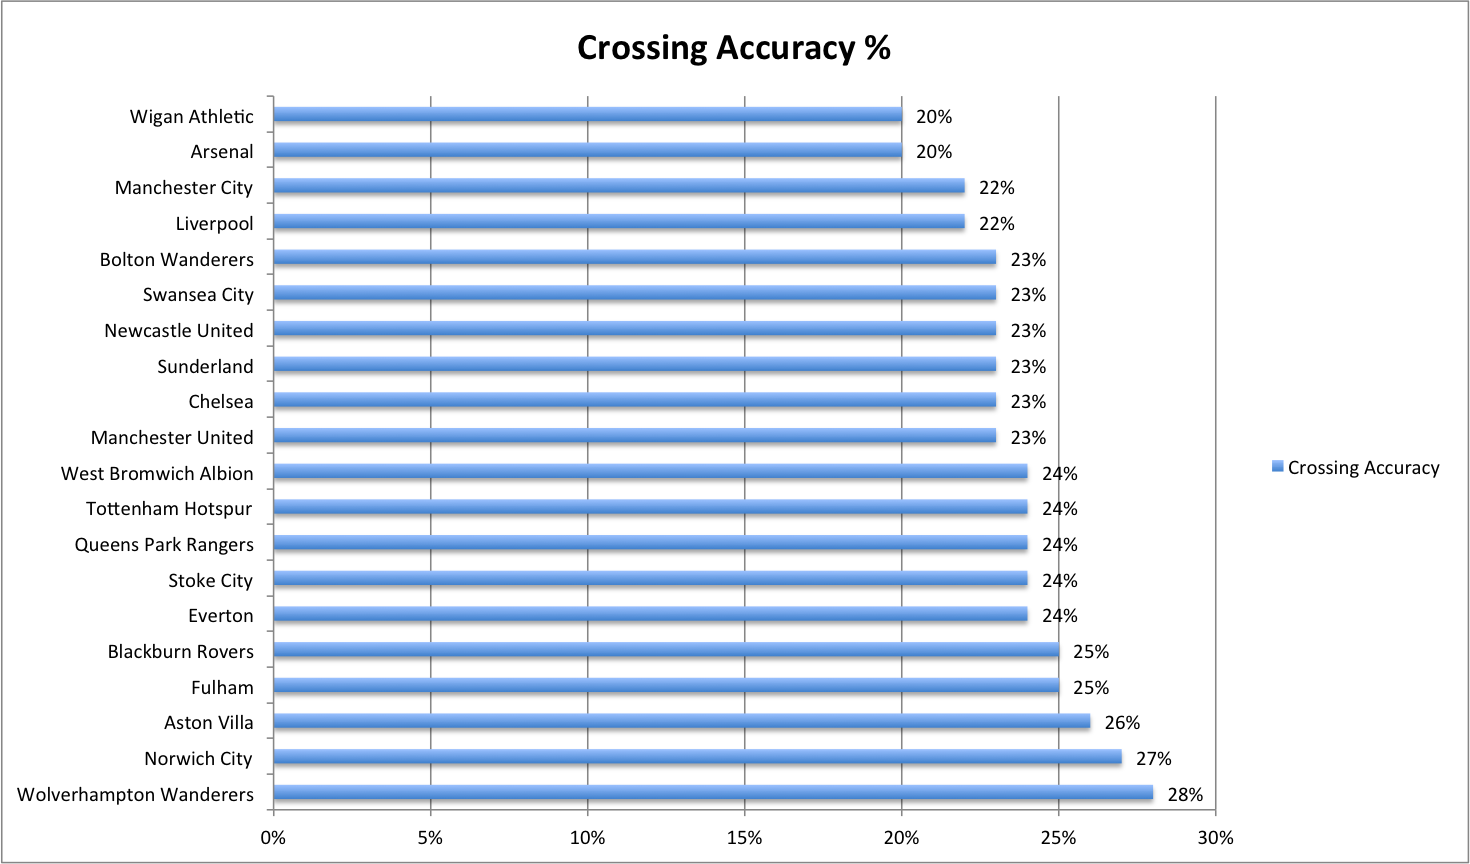
Considering the statistics above it’s not surprising that our crossing accuracy is quite poor this season compared to other teams. With a 22% crossing accuracy only Wigan and Arsenal at 20% have a poorer crossing accuracy this season. However, there is a slight increase in last season’s crossing accuracy of 20%.
Attacking
Lastly let’s take a look at the attacking statistics for this season, and let us start off on a positive note (because there aren’t many) as the rest is going to make for grim reading for Liverpool fans.
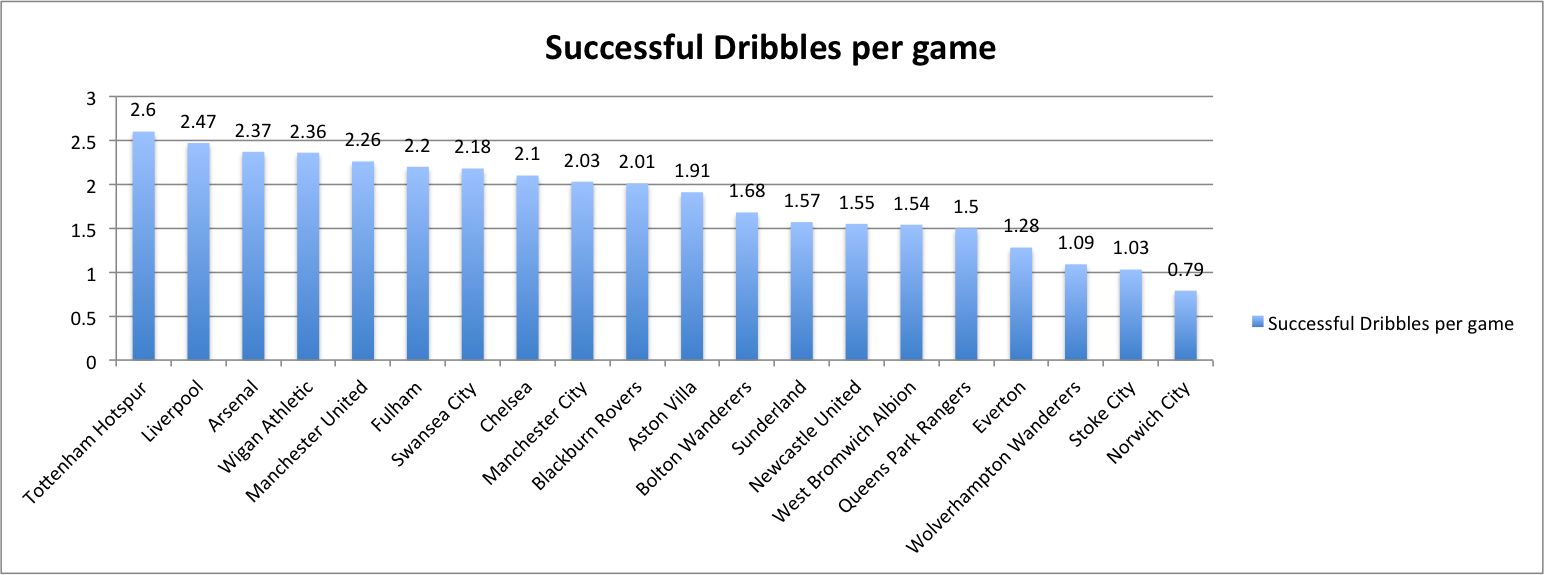
Some people, me included, have suggested we may need to buy a player with some creativity in the January transfer window. Mainly a player with pace, who can dribble, and who can beat a man with skill and pace. Try to add a bit of unpredictability to our forward play, as at times it’s seems like we can go quite stale when we reach the final third. Am I/we wrong though? At 2.47 successful dribbles per game only Spurs can better us with 2.6 per game. It is also an increase on last year’s 2.21 successful dribbles per game. Despite this statistic it still seems to me we need this kind of player in our ranks. Perhaps our successful dribbles are happening in an area of the pitch that doesn’t have the greatest of impact?
Next let’s take a look at the totals for the number of chances created from open play this season.
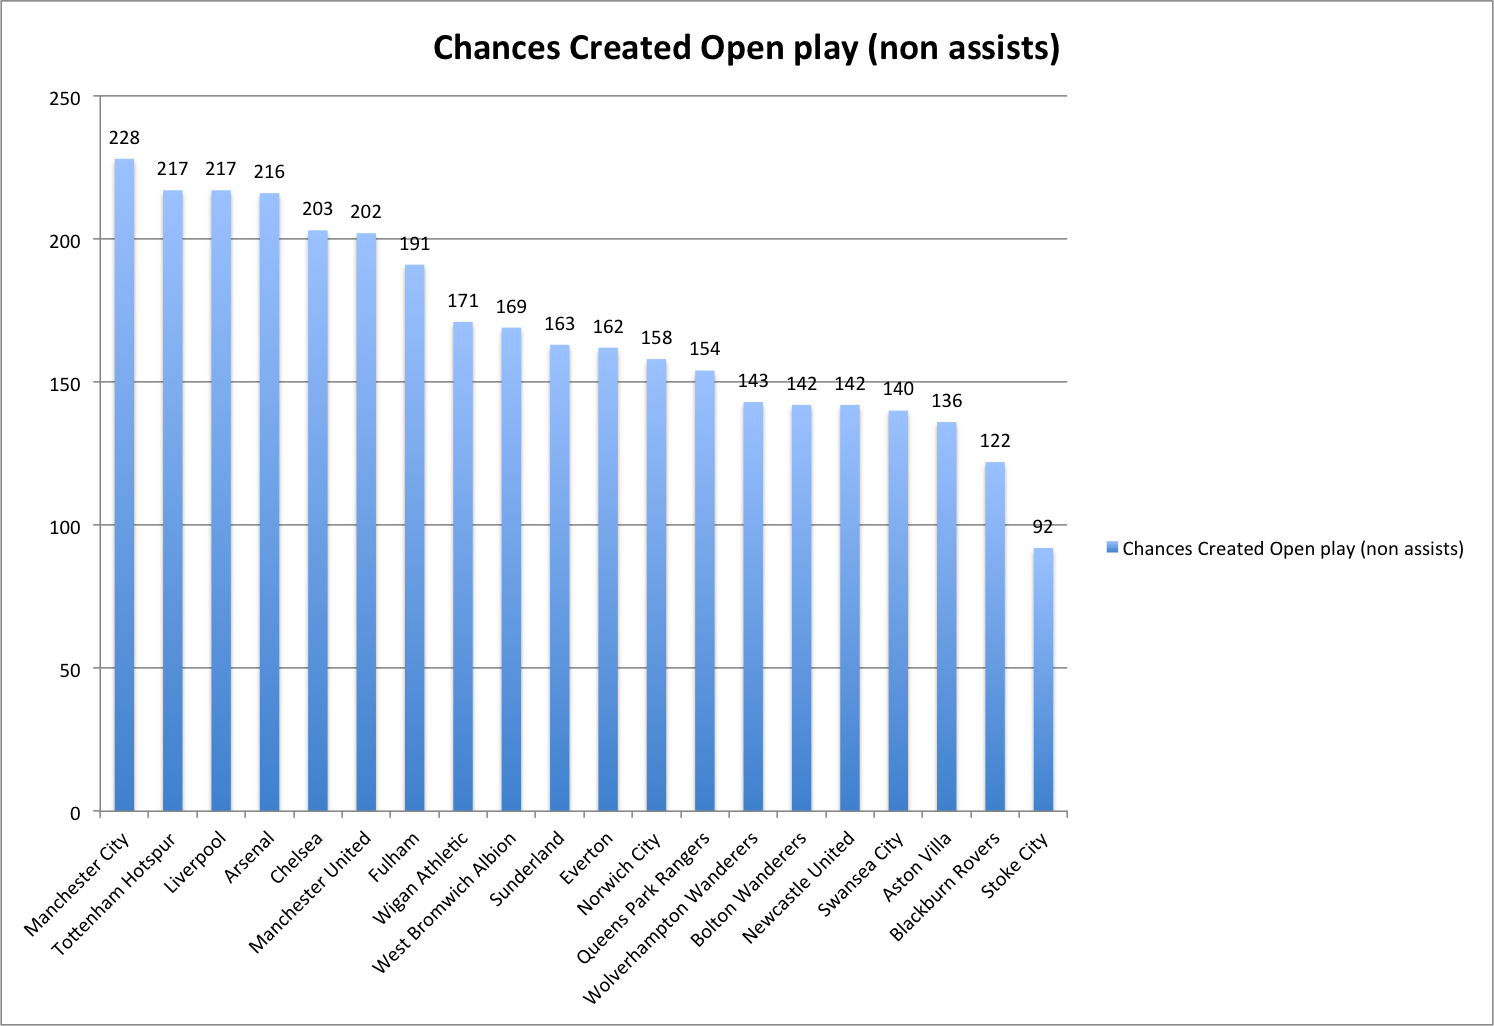
From the chart, only Manchester City have created (228) more chances than us this season. Liverpool have created 217 chances this season or 10.85 per game. Compare that to last season where we created 8.87 chances per game and you can see we have definitely improved the number of chances we are creating. So why are we scoring so little then? Well it’s clear we are not scoring enough from these chances as our chance conversion rate is the joint lowest in the league with Wigan at 9%.
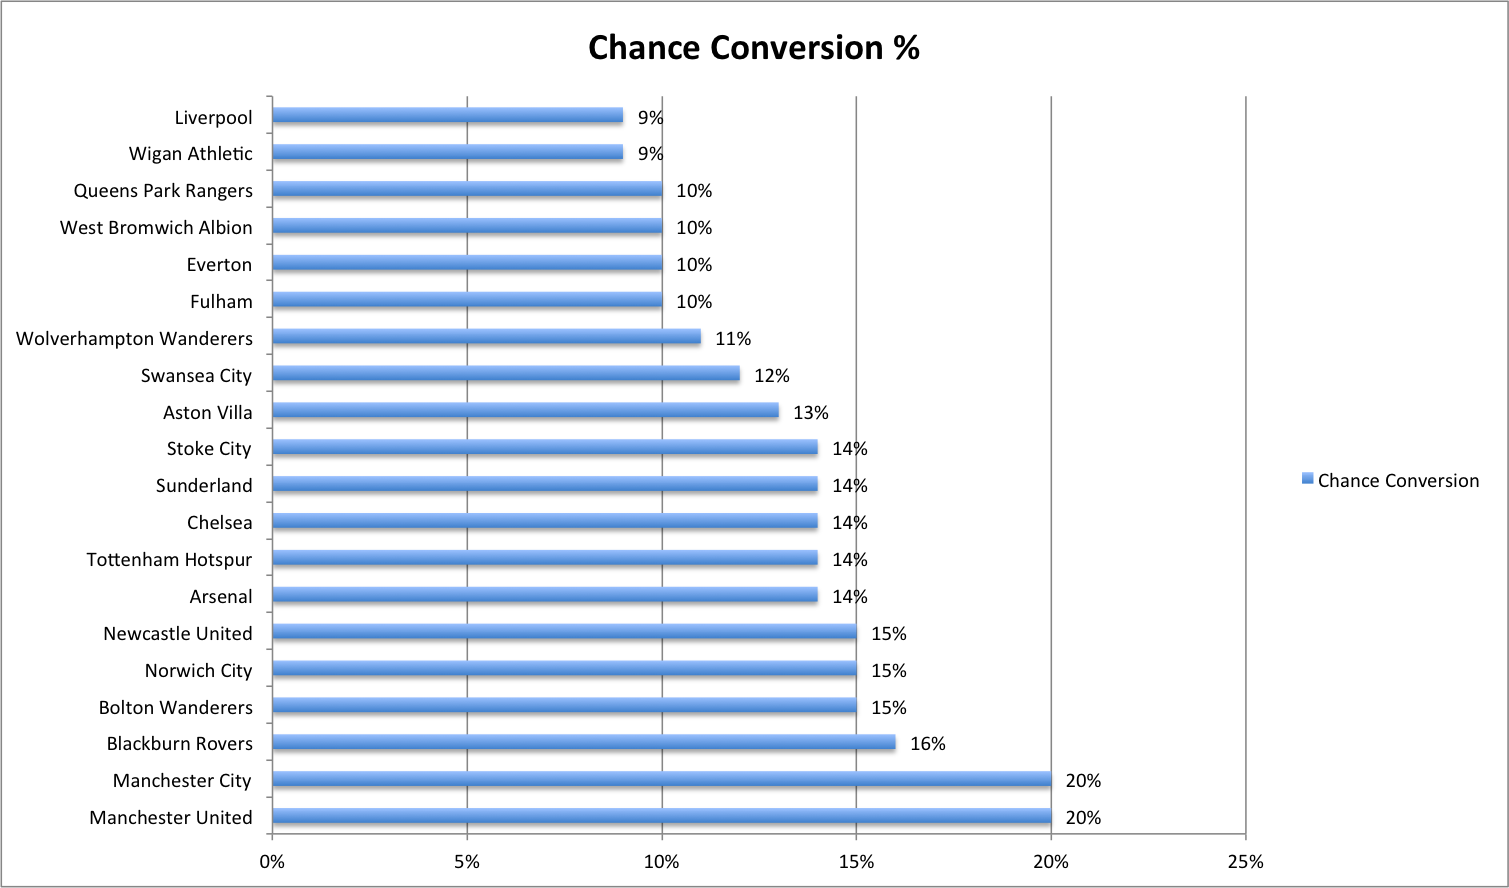
City and United top the table with an incredible 20% chance conversion rate, which at times this season was up at 29%. To put that statistic into perspective, last season’s best stat was Man United with 16% chance conversion. This really sets the bar and shows how much we need to improve in this area. At 13%, even last season’s chance conversion rate was better. It’s one of the few stats where LFC are doing worse this year.
Lastly let’s take a look at the shooting statistics for this season. Take a look at the shots on/off chart below.
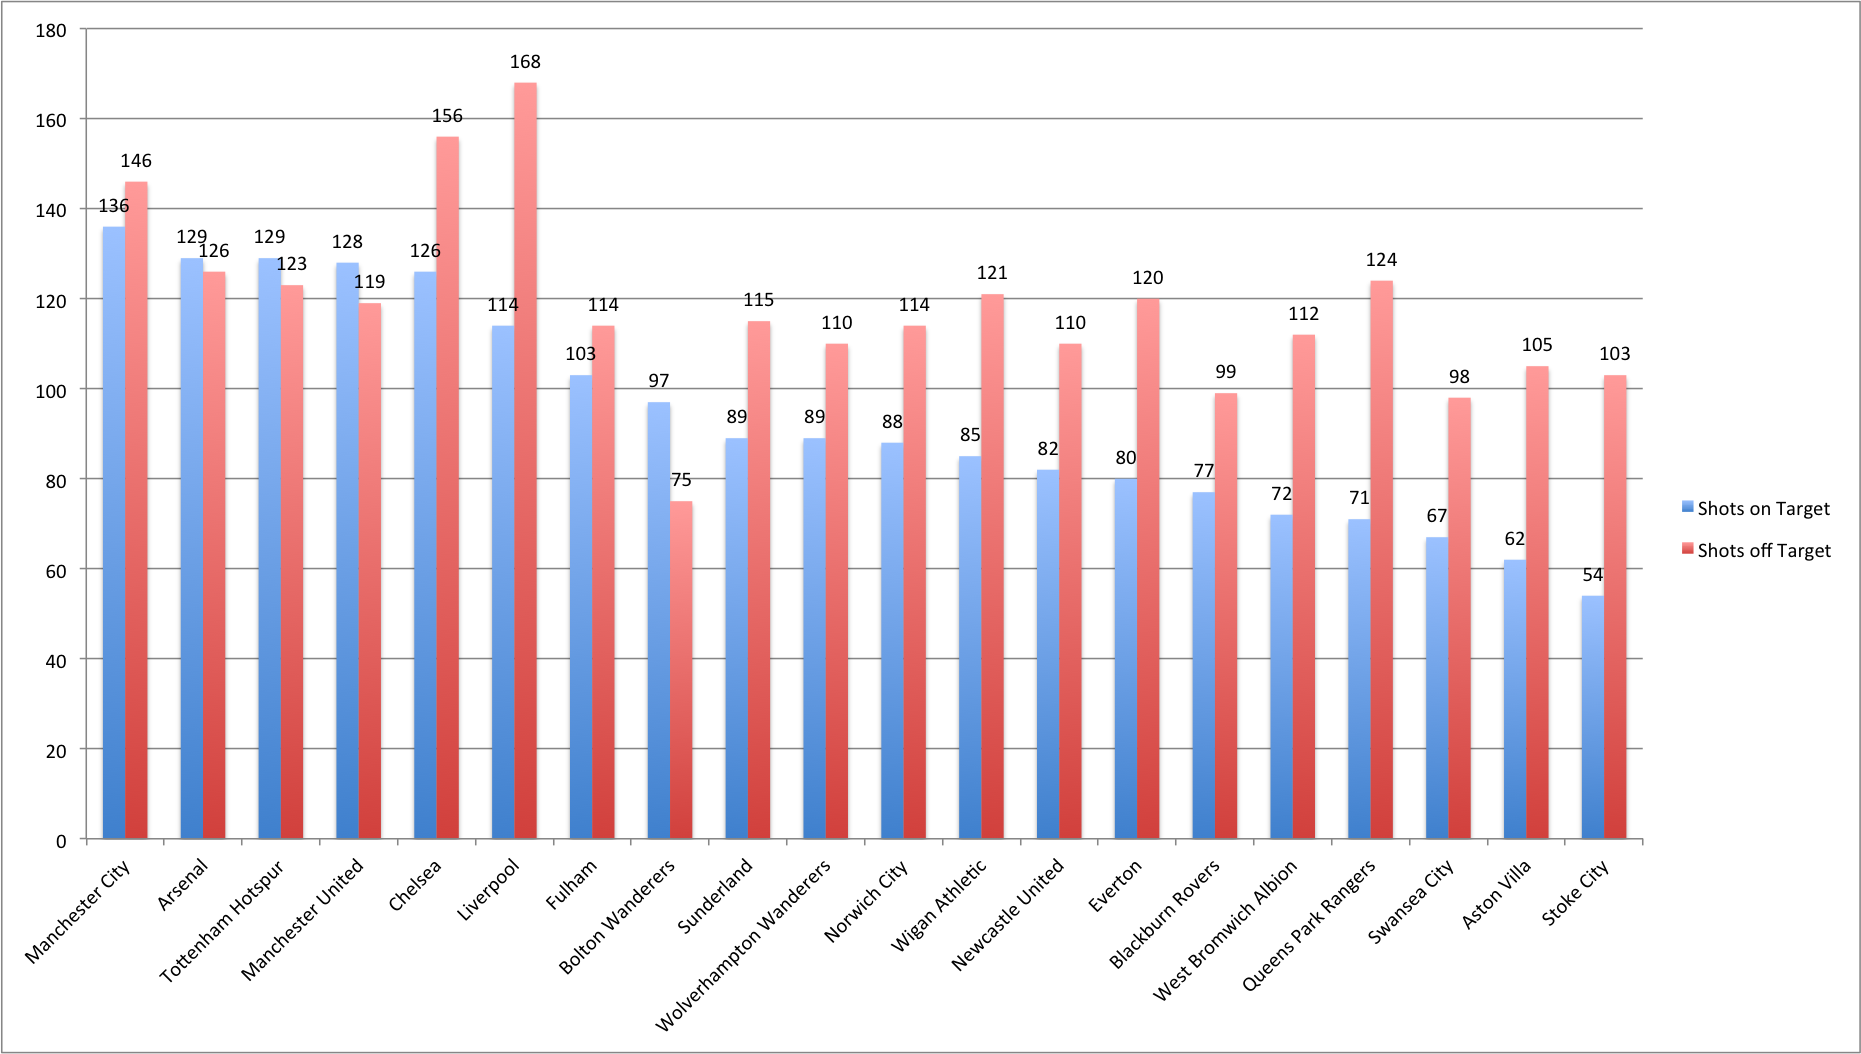
With 168 shots off target Liverpool have had more shots off target than any other team this season. Maybe a reason why the likes of Norwich, Blackburn, Sunderland and Bolton have scored more goals than us this season. We are averaging 8.4 shots off target per game compared to last season when we averaged 6.03 shots off target per game. We have had 114 shots on target so far this season at 5.7 shots on target per game, whereas last season we averaged 5.39 shots on target per game last season. So not much of a difference between the two seasons when it comes to shots on target per game.
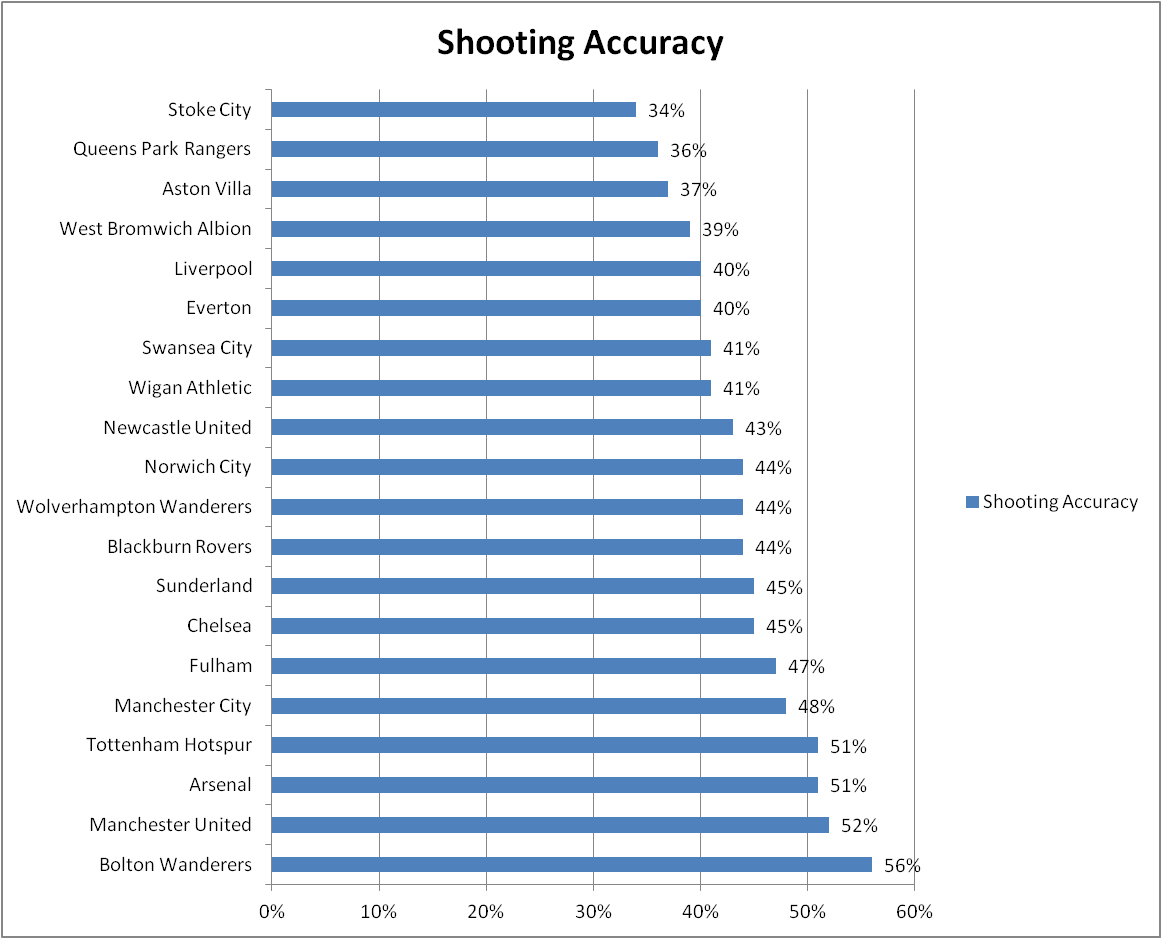
Not surprisingly our shooting accuracy percentage is quite low at 40%. Bolton surprisingly top this statistic with an incredible 56% of all their shots on target. I had to check this statistic three times on EPLIndex to make sure it was right. When you consider we had the second best shooting accuracy in the league last season at 47% then you can see this is an area where we really need to improve this year. Arsenal topped the shooting accuracy stats last year with 48%. So the bar has been raised quite considerably this year with Spurs, Arsenal, United and Bolton all with percentages in the 50’s. So in summary:
Summary
- Liverpool have won 53% of their ground duel 50-50’s, more than any other team in the Premiership this season, and have improved on last season’s rate of 51%.
- Liverpool, along with Spurs and Stoke, have the joint best aerial duel 50-50 win percentage (57%) in the Premiership this season.
- Last season Liverpool won 69% of all their tackles. This season we are winning 74.55% of all our tackles.
- Only Spurs (106), Wolves (105) and Everton (89) players have been dribbled past less than Liverpool (115) this season.
- This season Liverpool are averaging 483.9 passes per game, last season we averaged 440.2 passes per game. So we are attempting 43.7 more passes this season per game.
- Liverpool completed a total of 168 successful crosses last season. This season we have all ready completed 133 successful crosses.
- Only Spurs have completed more successful dribbles per game (2.6) than Liverpool (2.47) this season.
- This season we have created 217 chances at 10.85 per game, an improvement on last season’s 8.87 per game. Only Man City (228) have created more chances than us this season.
- However, along with Wigan, we have the joint worst chance conversion rate at 9% this season.
- We have had more shots off target (168) than any other team this season and our shooting accuracy is at 40%, down on last season’s 47%, which only Arsenal could better last season.
The statistics back up the fact that our defending in the Premiership this season has been much improved with only Man City conceding more goals than us this season. You can always improve, but we have done very well in this area. Our passing statistics are also quite impressive considering the influx of new players and all the idiosyncrasies that go along with gelling these new players together. However, it is an area where we need a slight improvement. Our attacking statistics are good on one side and terrible on the other. While we are having more shots and creating more chances than ever it’s clear we are not finishing enough of them. It is an area where we need to drastically improve in the second half of the season. Something to think about.
You can follow me here on twitter: https://twitter.com/#!/stemc74

Fantastic!! I love viewing stats like this. I would be interested in seeing this same mid season stat summary in comparison going back to 2005, 2000, 1995 and 1990 so you can compare the overall style change in the Prem. I just saw an archive game circa 1993. Was Man City vs Man United. At the time the game had many top players. I recall how much both teams played the long ball and how less technical and more physical the game was. Always interesting.
Please I don’t understand what u mean by ManShiteh Conceeding more Goals than Us? We still have d Best Defence in d Premiership? Right?
[…] Liverpool – Mid-Term Statistical Report – Anfield Index […]