
What xG Can’t Tell You
Liverpool’s 3-0 victory over Brentford last weekend was a travesty. Or at least it was if you choose to live and die by expected goals as your means of adjudication, with FBRef deeming it the joint-sixth most unjust result in the 2023/24 Premier League. Still, at least it wasn’t Aston Villa 6 (1.6 xG), Brighton 1 (1.7), which was utterly ridiculous.
If you check Understat, the expected goal score at Anfield on Sunday was 1.56 to 1.45 in the Reds’ favour, while FBRef went with 1.7 to 1.6; a little higher but the same margin. Once you find that it was closer still on SofaScore (1.71 plays 1.68) and the Bees actually led the xG on Flashscore (1.52 to 1.32), you swiftly realise that expected goals mean very little in a single game.
Football is far too random for any mathematical model to account for every single factor which contributes to the value of a goal scoring opportunity. If you want to know which team dominated a match, the momentum timeline (like this one from SofaScore for the Brentford game) might be more use.
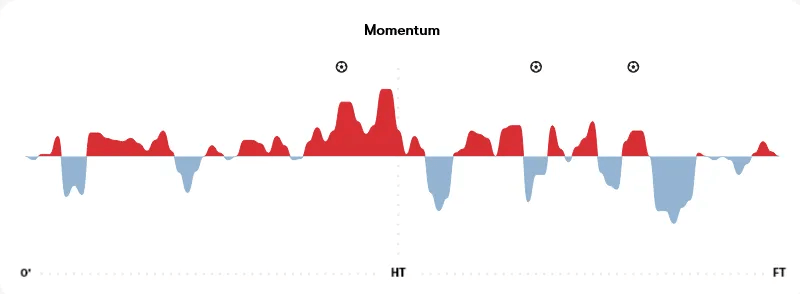
This shows how the Bees had their best sustained spell after going 3-0 down, which tallies far more with memories of the match than a fairly even xG score line. We shouldn’t be too hasty in dismissing expected goals, though. Over a longer period it can tell us more than results, and with broadly one third of this season in the books, it’s worth taking a closer look.
Bigger Samples Required
Again, discrepancies can occur, though, if not so much for Liverpool at present. Sort the Premier League by expected goal difference on FBRef and the Reds retain their second spot behind Manchester City and with Arsenal tucked in behind them.
But then come Chelsea (who are currently 10th in the actual table) and Newcastle (seventh), while Tottenham (4th) are only 10th for xGD with Manchester United (6th) in the spot below them. At least Spurs have had a good time through their overachievement; the Red Devils have benefitted from unlikely and/or late goals from the likes of Scott McTominay, Diego Dalot and Victor Lindelöf, and have still been rubbish for all concerned (schadenfreude aside).
The data for this season is being somewhat artificially blurred in two ways. As discussed in this column last week, added time is through the roof in the Premier League. Liverpool has already played seven league matches this season in which the minimum stoppage time hit double figures; while there’s no easy way to check, it’s doubtful whole campaigns saw as many matches which met this criterion in the past.

Red Card’s Rocket
But something else which has exploded and has a greater impact is red cards. The preceding five seasons of top flight football in England saw an average of 0.11 dismissals per game, yet that has more than doubled to 0.23 in 2023/24, with the total of 27 this term just three shy of the tally from last season.
Every single team in the division has already played at least one match which featured a red card, whereas Bournemouth, Nottingham Forest and West Ham got through 2022/23 with 22 players on the pitch at all times. Even without accounting for added time, Premier League teams have collectively amassed 735 minutes at least one man down – a shade over eight full matches – with Liverpool the most heavily depleted side so far.
While the red card rate will inevitably cool down – it has always tended to in seasons past – at this point it makes quite an impact on the data. It was therefore fascinating to see a table of adjusted expected goal difference per 90 minutes in a recent article on ESPN. The below chart from the piece excludes penalties and only includes time when both teams had 11 men on the pitch.
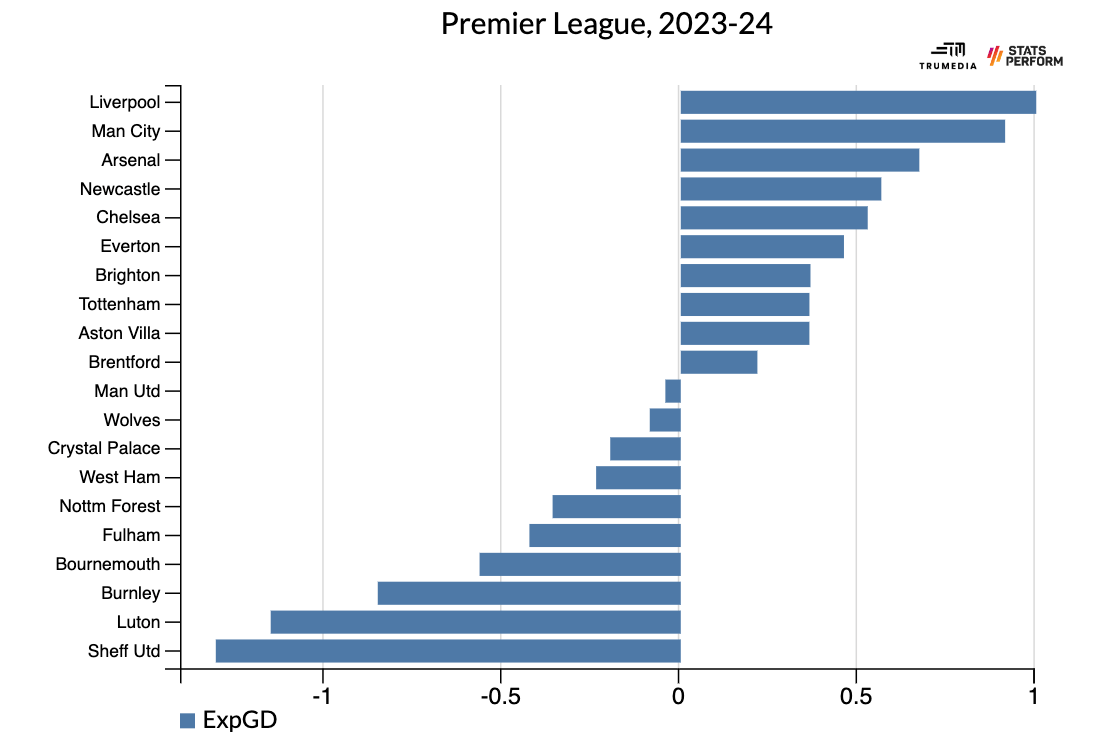
As long as Liverpool can retain its full complement of players for the rest of the season, this data bodes very well. Yet the findings are not entirely surprising either; the Reds generated more expected goals with nine men at Tottenham than Spurs did when the match was 11-a-side, after all.
League Winning Defensive Form?
Per FBRef, Liverpool has conceded 1.20 xG per 90, which is a 0.14 improvement on the horrors of last season but still behind the five campaigns prior to that. However, with 11 on the pitch their average is 0.96, essentially the same as when they won the league (0.99). The difference when receiving a red card is stark too – 2.63 xG per 90 conceded with 10 men, 3.34 with nine, and 2.73 overall with fewer than 11.
While the difference is not as severe, the same inevitably occurs with Liverpool’s attacking stats. Their expected goal difference per 90 is 0.99, with every team in the last five seasons to be at or above that mark finishing second at worst. With 11 men it rises to 1.43, which – aside from the Reds in 2021/22 – has been the sole preserve of City in recent years.
And, of course, these figures include the match with Brentford, as nobody received a red card in that game. That fixture might have been close on the underlying data but it pays to look beyond a single match. It demonstrates the elite quality of the Liverpool class of 2023/24.