
Statistical Analysis by Anfield Index
Dominating Possession: Liverpool’s Tactical Supremacy
In the beautiful game, possession is nine-tenths of the law. Liverpool’s recent performance against Burnley, as showcased by Futmob’s detailed data, highlights a stark dominance in ball control. With a commanding 69% possession, the Reds’ strategy of retaining the ball reflects a philosophy ingrained within the club’s modern ethos. This level of control not only stifles the opposition but also sets the stage for a relentless offensive display.
Precision in Passing: The Red Machine’s Efficiency
Performance data and stats reveal that Liverpool’s accuracy in passing was nothing short of exemplary. Achieving an impressive 85% accuracy with 558 successful passes, the team’s tactical discipline shone through. The data underscores a performance built on the backbone of meticulous preparation and training ground drills. The team’s midfield generals orchestrated play with precision, allowing the attackers to weave their magic in the final third.
Converting Chances: An Area for Improvement
Despite the overwhelming control and precision, Liverpool’s conversion rate poses a conundrum. The expected goals (xG) metric, which stands at 1.69, juxtaposed with the actual shots on target, suggests a shortfall in finishing prowess. With 19 total shots and a huge 10 on target, there’s a glimpse into an area ripe for improvement. Performance data and stats lay bare the reality that opportunities were created, but the clinical edge was somewhat blunted. Burnley’s defence might have been breached, but not as ruthlessly as the numbers would have liked.
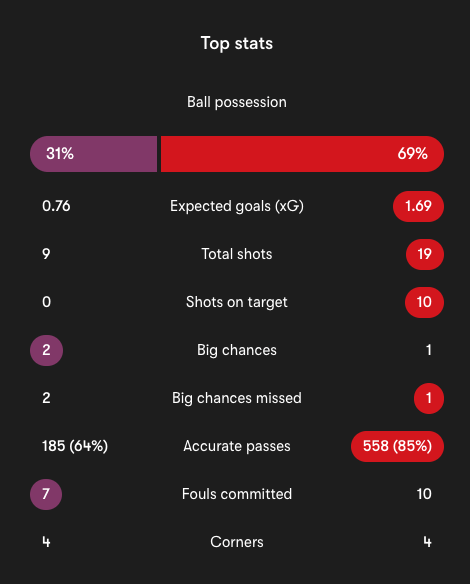
In contrast, Burnley’s resilience can be admired, with their expected goals at a modest 0.76. The Clarets managed to carve out chances, as signified by their ‘big chances’ count, which, although fewer, were substantial. The disparity in possession may paint a picture of a one-sided affair, but football is often a tale of efficiency over exuberance. Burnley’s commitment to disrupting Liverpool’s rhythm is seen in the number of fouls committed and the equal number of corners won, suggesting a battle fought with tenacity.
As the dust settles on a game dissected by data, the narrative woven by statistics speaks volumes. Liverpool’s performance data and stats indicate a team operating like a well-oiled machine, yet there remains a gap to bridge between domination and decisiveness. The Anfield Index’s statistical analysis peels back the layers of a performance that, while impressive, leaves room for that cutting edge that separates the good from the great.